BWTEE 2.3.4
This example comes from Biological Wastewater Treatment: Examples and Exercises page 36 Example 2.3.4.
- Online supplementary materials of this book can used to be found in supplementary material-zipped.zip, this download link was found in Biological Wastewater Treatment: Examples & Exercises, the Download book flyer link.
- However, all these download links are no longer available (2024.12.28), and we have not yet located a valid online link for supplementary materials.
- IF ANYONE FIND THE LINK, PLEASE LET US KNOW ([email protected]). THANKS!
You could find the corresponding AQUASIM project file in Chapter 2/SI_Chapter_2_Aquasim_BNR-Guilds-Growth-Models_Batch-Chemostat.aqu.
If you just input the BioModel and DataSet details as described in the book, you cannot get the result as the book's figures. Because the AQUASIM project details are not the same as in the book.
Batch
SIMPO project for this example could be found in BWTEE 2.3.4 Batch.
Create
Create the BioModel, DataSet and Project exactly as in AQUASIM project file (not the book).
Result
The measured data are the AQUASIM calculation results.
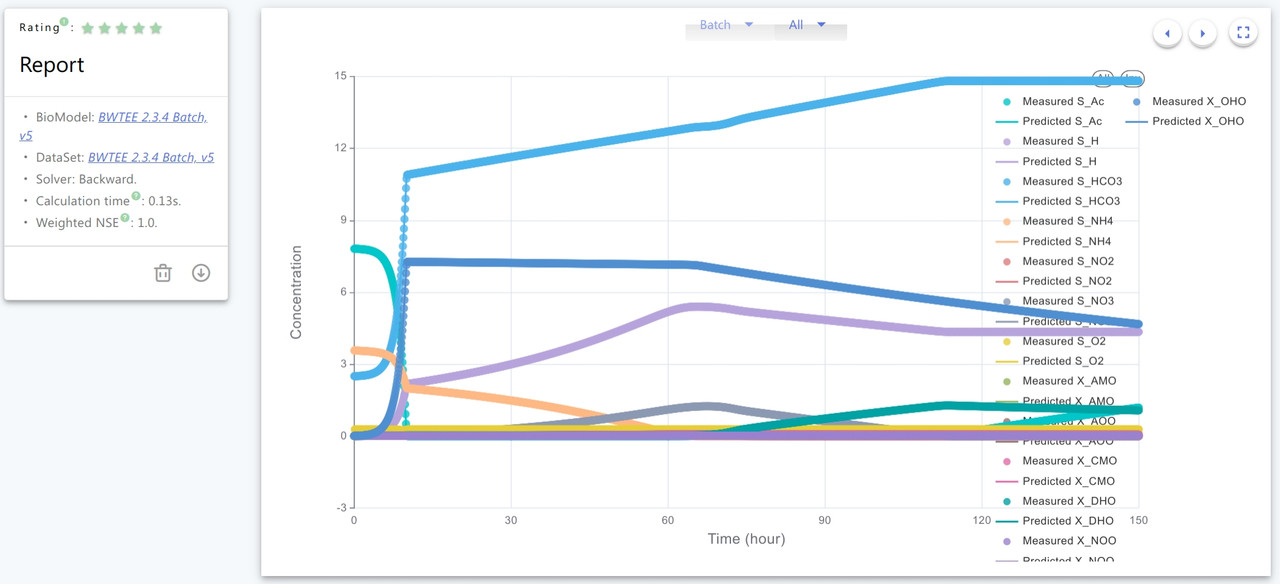
The Weighted NSE is 1.0, which means the simulation result generated from SIMPO is almost the same as in AQUASIM.
Chemostat
SIMPO project for this example could be found in BWTEE 2.3.4 Chemostat.
Create
Create the BioModel, DataSet and Project exactly as in AQUASIM project file (not the book).
Result
The measured data are also come from the AQUASIM calculation, but with less result sampling rate. To increse the calculation speed, the sampling rate decrease from 1h/point to 5h/point.
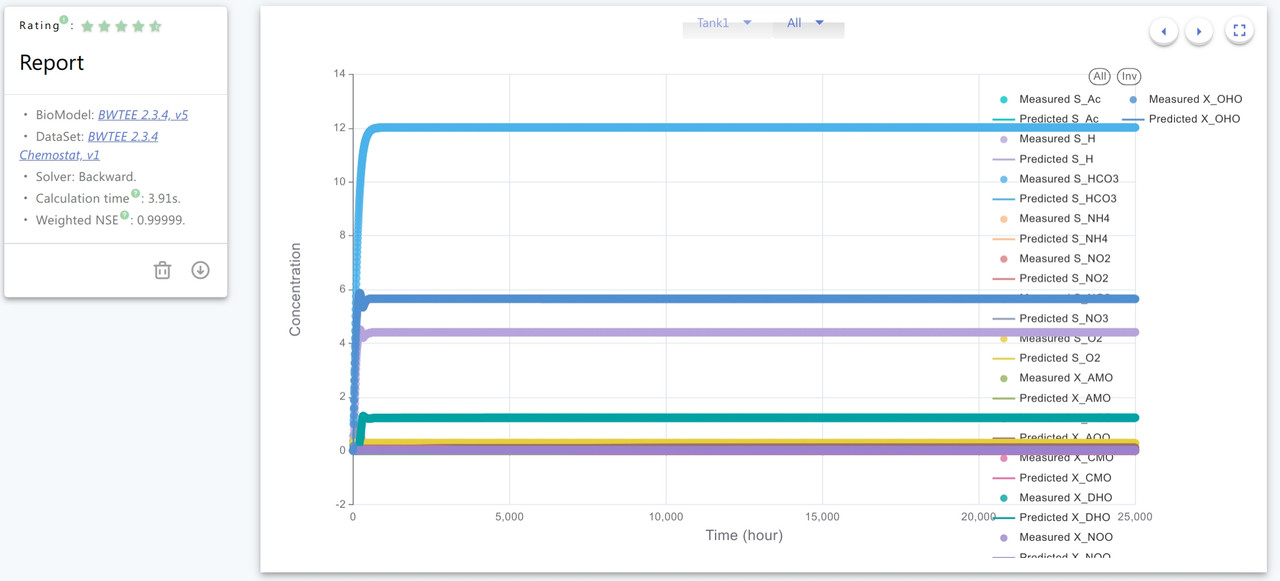
The Weighted NSE is 0.99999, the slight difference comes from S_O2 (NSE is 0.99992) and X_DHO (NSE is 0.99999), and all of the NSE of the others are 1.
S_O2
-
SIMPO will dynamically adjust the time interval to improve calculation speed and ensure accuracy in the mean time, if the simulation become more and more stable, the time interval will become larger.
-
The volumetric mass transfer coefficient (
k_L_a) ofS_O2in this example is100 mmolO2/hand the rate expression isk_L_a*(S_O2_sat-S_O2), which makes the rate of Aeration process won't decrease and could be very large if the time interval become large, and this is the reason that cause the difference. -
To get stable result of
S_O2, we should lower the Amplified Rate (to1.0001) and Step Tolerance (to0.0001). -
The stable value (last few points) of AQUASIM is
0.28and SIMPO is around0.2799.
X_DHO
-
The difference in
X_DHOcould just be the accuracy error of decimal separator, the stable value (last few points) of AQUASIM is1.232and SIMPO is1.23248.